Friday, May 29, 2015
Wednesday, May 27, 2015
Friday, May 15, 2015
Wednesday, May 13, 2015
Monday, May 4, 2015
INFOGRAPHICS
INFOGRAPHICS- Infographic's are graphic visual representations of information,data or knowledge that is intended to present complex information quickly and clearly. Infographic is related or referred to the data visualization,information design or information architecture. Christoph Scheiner and William Playfair use the word Infographics.
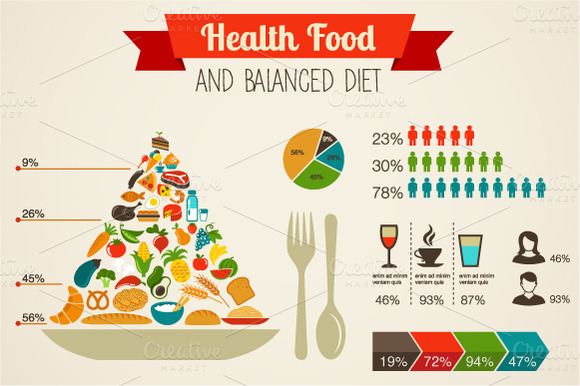 A plate of food is being shown and percentages of what you should eat to stay healthy.https://d3ui957tjb5bqd.cloudfront.net/images/screenshots/products/1/13/13483/food-infographics1-f.jpg?1365667686
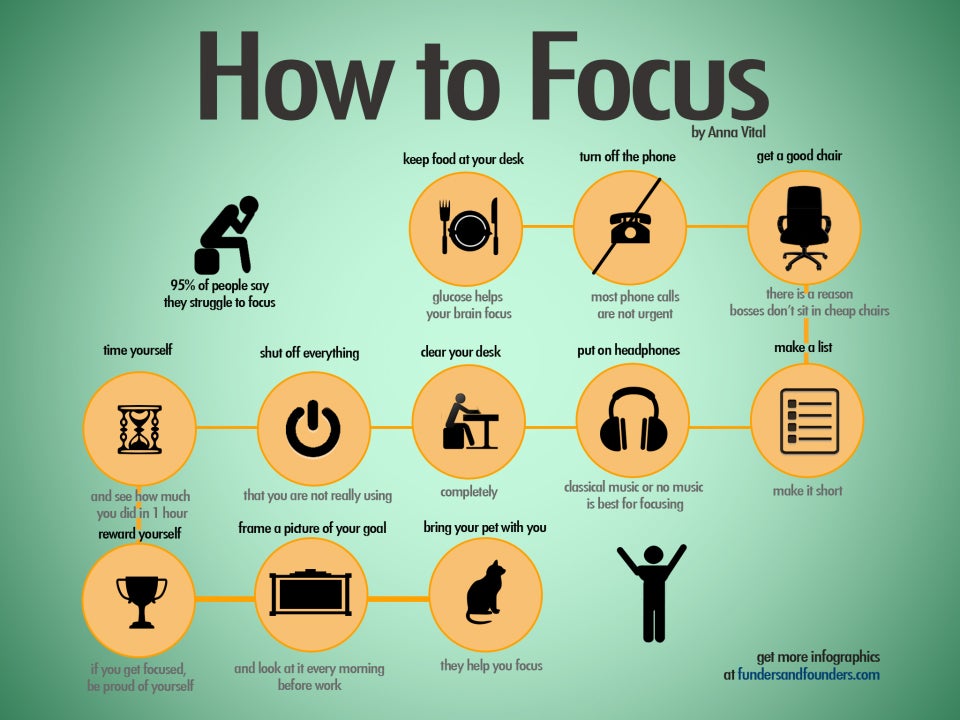 It shows how you can keep focus and not get distracted by little things. https://assets.entrepreneur.com/static/1420832715-focus-info.jpg
 This picture shows simple steps on how you can work faster if you have a lot of work to do http://assets.entrepreneur.com/article/1388769630-let-go-keep-simple-move-quickly-secrets-being-productive-entrepreneur-infographic-4.jpg
 This picture show how you can get up early and not sleep over time and be late to work
 A plate of food is being shown and percentages of what you should eat to stay healthy.https://d3ui957tjb5bqd.cloudfront.net/images/screenshots/products/1/13/13483/food-infographics1-f.jpg?1365667686
 It shows how you can keep focus and not get distracted by little things. https://assets.entrepreneur.com/static/1420832715-focus-info.jpg
 This picture shows simple steps on how you can work faster if you have a lot of work to do http://assets.entrepreneur.com/article/1388769630-let-go-keep-simple-move-quickly-secrets-being-productive-entrepreneur-infographic-4.jpg
 This picture show how you can get up early and not sleep over time and be late to work
Wednesday, April 29, 2015
Friday, April 24, 2015
Wednesday, April 22, 2015
Monday, April 20, 2015
Layout Terms
1)A font serif is a small decorative line that establishes to the basic form of an original character
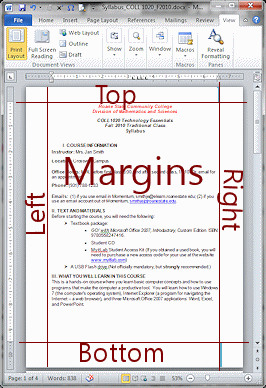
2)A margin is the edge or the border of something
3)A guide is something that helps you have better line control and do path controls easily through illustrator
4)Bleed refers to printing that goes beyond the edge of the sheet of paper before you trim it
5)CMYK is a color model used for color printing, it is also used for describing printing process itself
6)Image Resolution is the detail of an image that holds
7)Proof Copy is a copy of a book that is made from trial impressions that are are from composed type
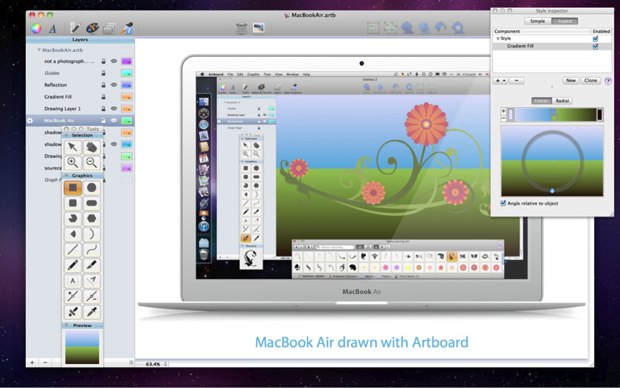
8)ArtBoard is a very unique and powerful feature from the illustrator
9)Registration Mark is a print outside the trim area of printing
Friday, April 17, 2015
Wednesday, April 15, 2015
Monday, April 13, 2015
Subscribe to:
Comments (Atom)


